

January 7, 2025
4 minimum read
Frigid temperatures are well below normal this week, but “normal” is getting warmer
A blast of arctic air is causing frigid temperatures far below normal in some parts of the U.S., but its “normal” background is warmer than in the past
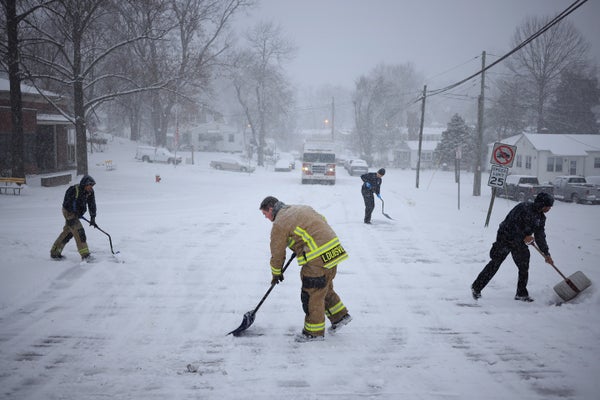
Louisville Fire Department Quint 9 firefighters shovel snow in front of their station on January 5, 2025 in Louisville, Kentucky. Local forecasts predicted significant accumulation of freezing rain and ice after the heavy snowfall.
Luke Charette/Getty Images
The following essay is reproduced with permission. ![]() The Conversation is an online publication covering the latest research.
The Conversation is an online publication covering the latest research.
The arctic blast that hit the central-eastern United States in early January 2025 is creating frigid conditions in many locations. Temperatures dropped to more than 20 degrees below zero in parts of North Dakota, and people as far south as Texas woke up to temperatures in the teens on January 6. A snow and ice storm that hit the central part of the country added to the coldness of winter.
Forecasters warned that temperatures “could be 10 to more than 30 degrees below average” across much of the eastern two-thirds of the country during the first full week of the year.
About supporting science journalism
If you enjoyed this article, please consider supporting our award-winning journalism. Currently subscribing. By subscribing, you help ensure future generations of influential stories about the discoveries and ideas that shape the world today.
But what does “normal” actually mean?
Temperature forecasts are important to keep people safe, but comparisons to “normal” can be very misleading. That’s because what is considered normal in projections has been changing rapidly over the years as the planet warms.
Definition of normal
One of the most commonly used criteria for defining science-based “normal” values is the 30-year average of temperature and precipitation. The National Center for Environmental Information updates these “normal values” every 10 years, most recently in 2021. The current period considered “normal” is 1991 to 2020. Five years ago was 1981-2010.
But temperatures have been rising over the past century, and the trend has accelerated since about 1980. This warming is being driven by the extraction and burning of fossil fuels, which increase carbon dioxide and methane in the atmosphere. These greenhouse gases trap heat near the Earth’s surface, leading to rising temperatures.
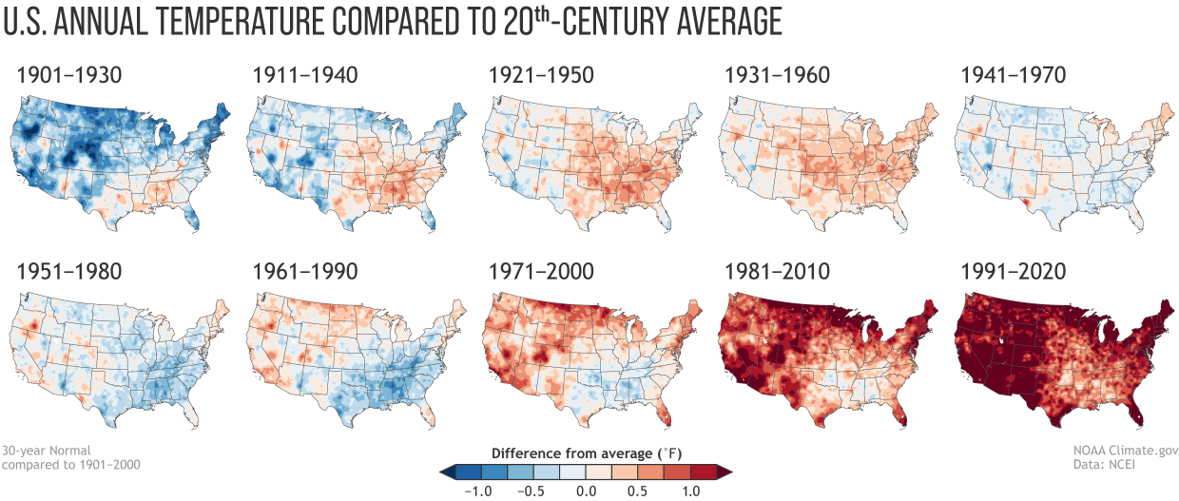
How have temperatures in the United States that are considered “normal” changed over the decades? Each 30-year period is compared to the 20th century average.
The Earth’s temperature is rising, so what is considered normal is also warming.
Therefore, if the 2025 cold wave is reported as the difference between actual and “normal” temperatures, it will appear colder and more extreme than when compared to the average temperatures of the previous 30 years.
Thirty years occupies a significant portion of a person’s life. For people under the age of 40, using the latest average span may be consistent with their experience.
But that doesn’t tell you how much the planet has warmed.
How does today’s cold wave compare to the past?
To see how today’s cold wave, or today’s warming, compares to the period before global warming started accelerating, NASA scientists used 1951 to 1980 as a baseline. I am.
The reason becomes clear when you compare the maps.
For example, in January 1994, it was bitterly cold east of the Rocky Mountains. If you compare temperatures in 1994 to today’s “normal” years, or the period from 1991 to 2020, temperatures in the United States look a lot like the map in early January 2025. Much of the Midwest and East of the United States was above 7 degrees Fahrenheit (4 degrees Celsius). Temperatures were below “normal” and even colder in some areas.
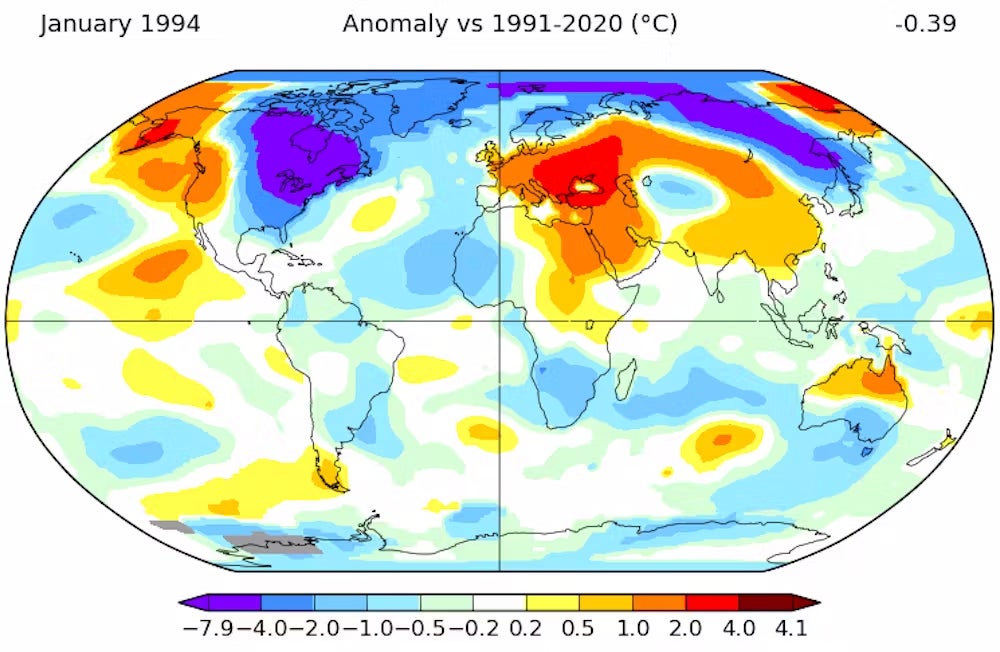
Compare January 1994 temperatures to the 1991-2020 average, the current 30-year average used to define “normal.”
NASA Goddard Institute for Space Studies
However, if we instead compare January 1994 to the 1951-1980 baseline, the cold spot in the eastern United States is neither as large nor as extreme.
Temperatures in some parts of the country in January 1994 were 14.2 degrees Fahrenheit (7.9 degrees Celsius) below normal compared to the 1991-2020 average but 12.4 degrees Fahrenheit (6.9 degrees Celsius) below normal compared to the 1951-1980 average. degree) was just low.
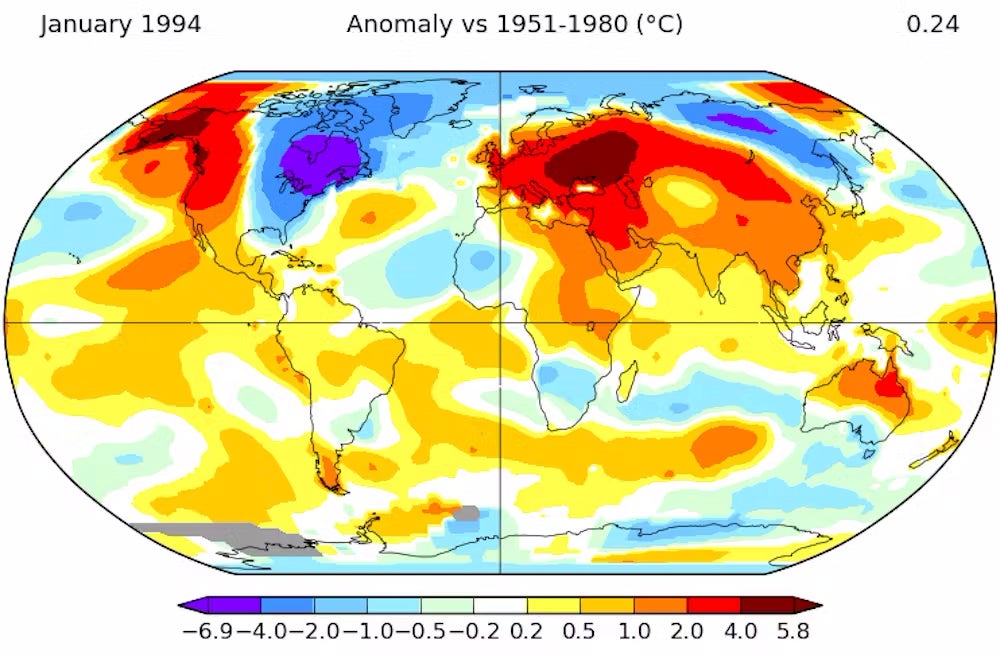
Temperatures for January 1994 compared to averages from 1951 to 1980.
NASA Goddard Institute for Space Studies
As a measure of climate change, a 30-year average baseline that is updated every 10 years makes warming appear smaller than it really is and cold waves appear more extreme.
Heavy snow conditions due to lake effect
The U.S. will continue to experience colder weather in the winter, but as the Arctic and other parts of the world warm, the coldest temperatures on record will become less common.
This warming trend is contributing to the remarkable conditions the Great Lakes will see in January 2025: widespread, heavy lake-effect snow.
As cold Arctic air entered from the north in January, it encountered the Great Lakes Basin, where water temperatures still exceeded 40 degrees Fahrenheit (4.4 degrees Celsius) in many places. As of January 4, less than 2% of the lake surface was covered by ice.
Evaporation occurs when cold, dry air falls over a warm surface of water, supplying moisture to lake-effect snow. Parts of New York and Ohio along lakes have seen well over a foot of snow over several days.
Heat buildup in the Great Lakes has been observed year after year, causing fundamental changes in the winter weather and winter economy of states adjacent to the lakes.
It also serves as a reminder of the permanently increasing presence of global warming, even in the midst of cold weather outbreaks.
This article was first published conversation. please read original article.