


Posted by: Mayank Jain – Product Manager, Yasser Dbeis – Software Engineer. android studio
Android developers tell us that they are looking for tools to help optimize power consumption for various devices on Android.
The new Power Profiler in Android Studio helps Android developers by showing the power consumption that occurs on a device while using an app. Understanding power consumption across Android devices helps Android developers identify and fix power consumption issues in their apps. You can run A/B tests to compare the power consumption of different algorithms, features, and even different versions of your app.
Apps that are optimized for low power consumption lead to better battery and thermal performance on your device, resulting in a better user experience on Android.
This power consumption data is made available through the On-Device Power Monitor (ODPM) on Pixel 6 and newer devices, segmented by each subsystem called a “power rail.” See Profileable Power Rails for a list of supported subsystems.
Power Profiler helps app developers detect issues in several areas.
- Detect unoptimized code that uses more power than necessary.
- Find background tasks that are causing unnecessary CPU usage.
- Identify wakelocks that keep your device awake when you don’t need it.
Once you’ve identified a power consumption issue, you can use Power Profiler to test different hypotheses to understand why your app is consuming excessive power. For example, if the problem is caused by a background task, developers can prevent the task from running unnecessarily or for a long time. Additionally, if the problem is caused by wakelocks, developers can release wakelocks when resources are not in use, or use wakelocks more judiciously. Next, use Power Profiler to compare the power consumption before and after the change.
In this blog post, we’ll show you how to use A/B testing to understand and effectively measure how your app’s power consumption characteristics change between different versions of the same feature.
A real-world example of how to use Power Profiler to improve your app’s battery life.
Suppose you have an app that allows users to purchase their favorite movies.
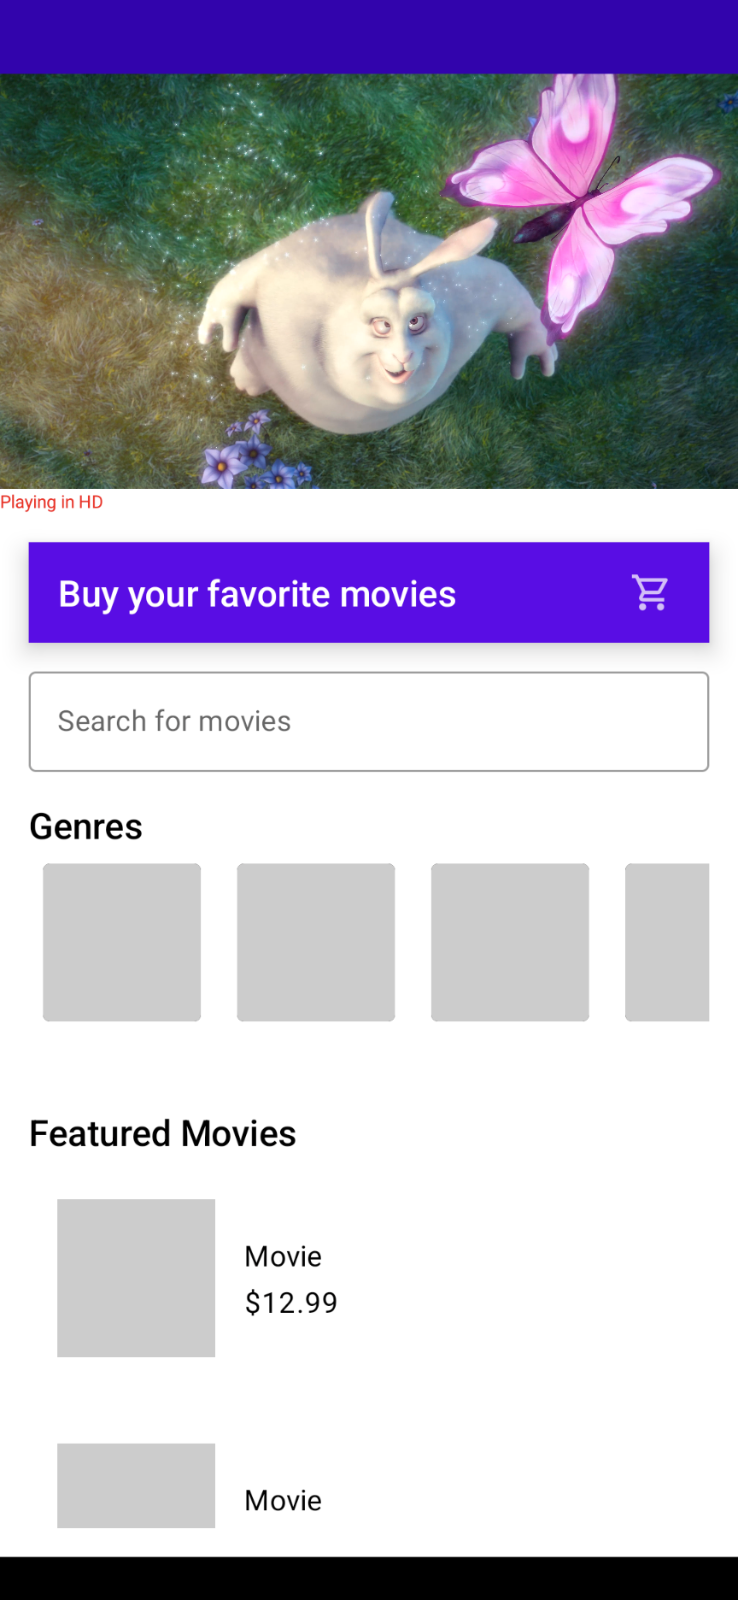
As your app becomes more popular and more users start using it, you’ll notice that high-quality 4K videos take a very long time to load every time you launch the app. Due to their large size, you need to understand the impact on the device’s power consumption.
Initially, the video was in 4K quality with the best intentions of presenting customers with the best movie highlights possible.
This makes me think…
- Do you really need a 4K video banner on your home screen?
- Does it make sense to load 4K video over the network every time I run my app?
- How will the power consumption characteristics of my app change if I replace the 4K video with a lower quality one (while still maintaining the vivid look and feel of the video)?
This is the perfect scenario to perform A/B testing of power consumption.
A/B testing allows you to test two slightly different variations of a video banner feature and choose the one with better power consumption characteristics.
Scenario A: Run your app with a 4K video banner on screen and measure power consumption
Scenario B: Run your app with a low-resolution video banner on screen and measure power consumption
Setting up an A/B test
Let’s take a moment to configure Android Studio Profiler to run this A/B test. You need to start the app and attach the CPU profiler to trigger a system trace (where the power profiler appears).
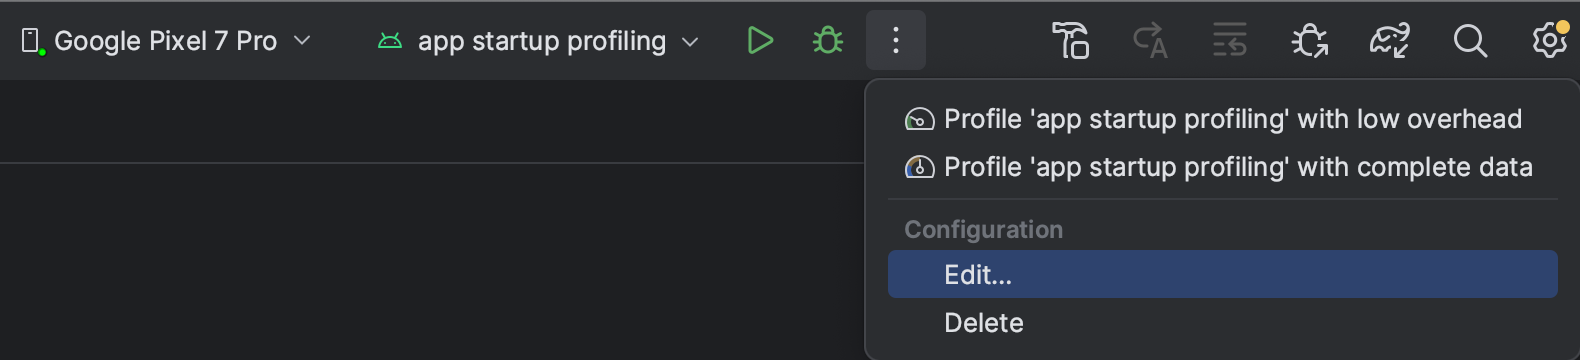
step 1
Click the three-dot menu > (Edit) to create a custom Run Configuration.
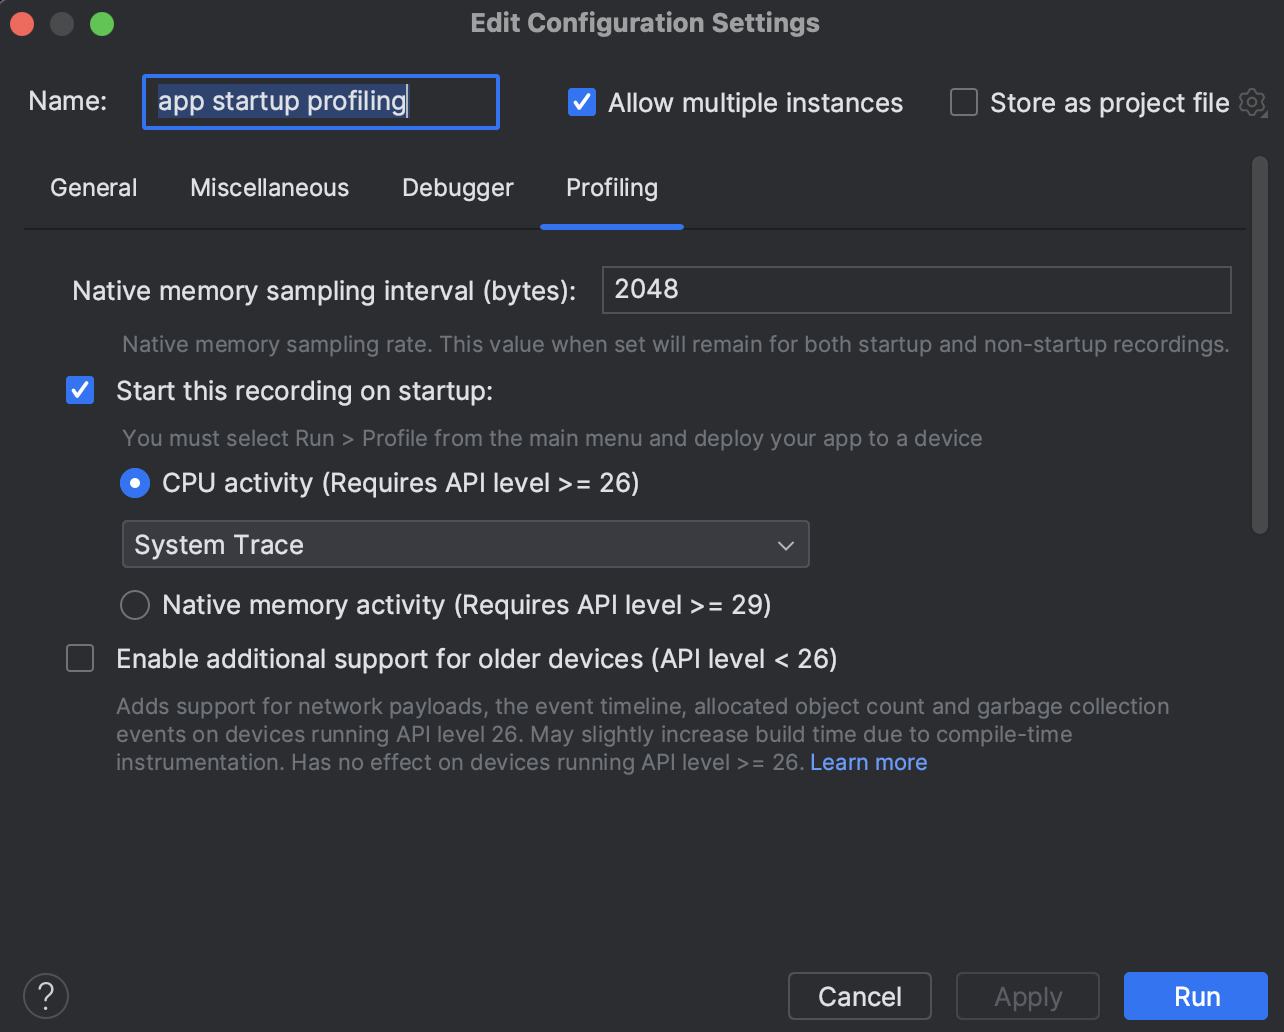
Step 2
Next, select the (Profiling) tab and make sure (Start this recording at startup) and (CPU Activity) > (System Trace) are selected. Then click Apply.
If you want to run this app from scratch and attach a CPU profiler, just run Low-Overhead Profile App Startup Profiling.
Notes on accuracy
The following example scenario uses the entire app launch to estimate power consumption for the purposes of this blog. However, using more advanced techniques, power measurements can be obtained with even greater accuracy. Some techniques to try include:
- Isolate and measure video playback power consumption only after a video player tap event.
- Use the trace marker API to mark the start and end times of a power measurement timeline and measure power consumption only within that marked window.
Scenario A
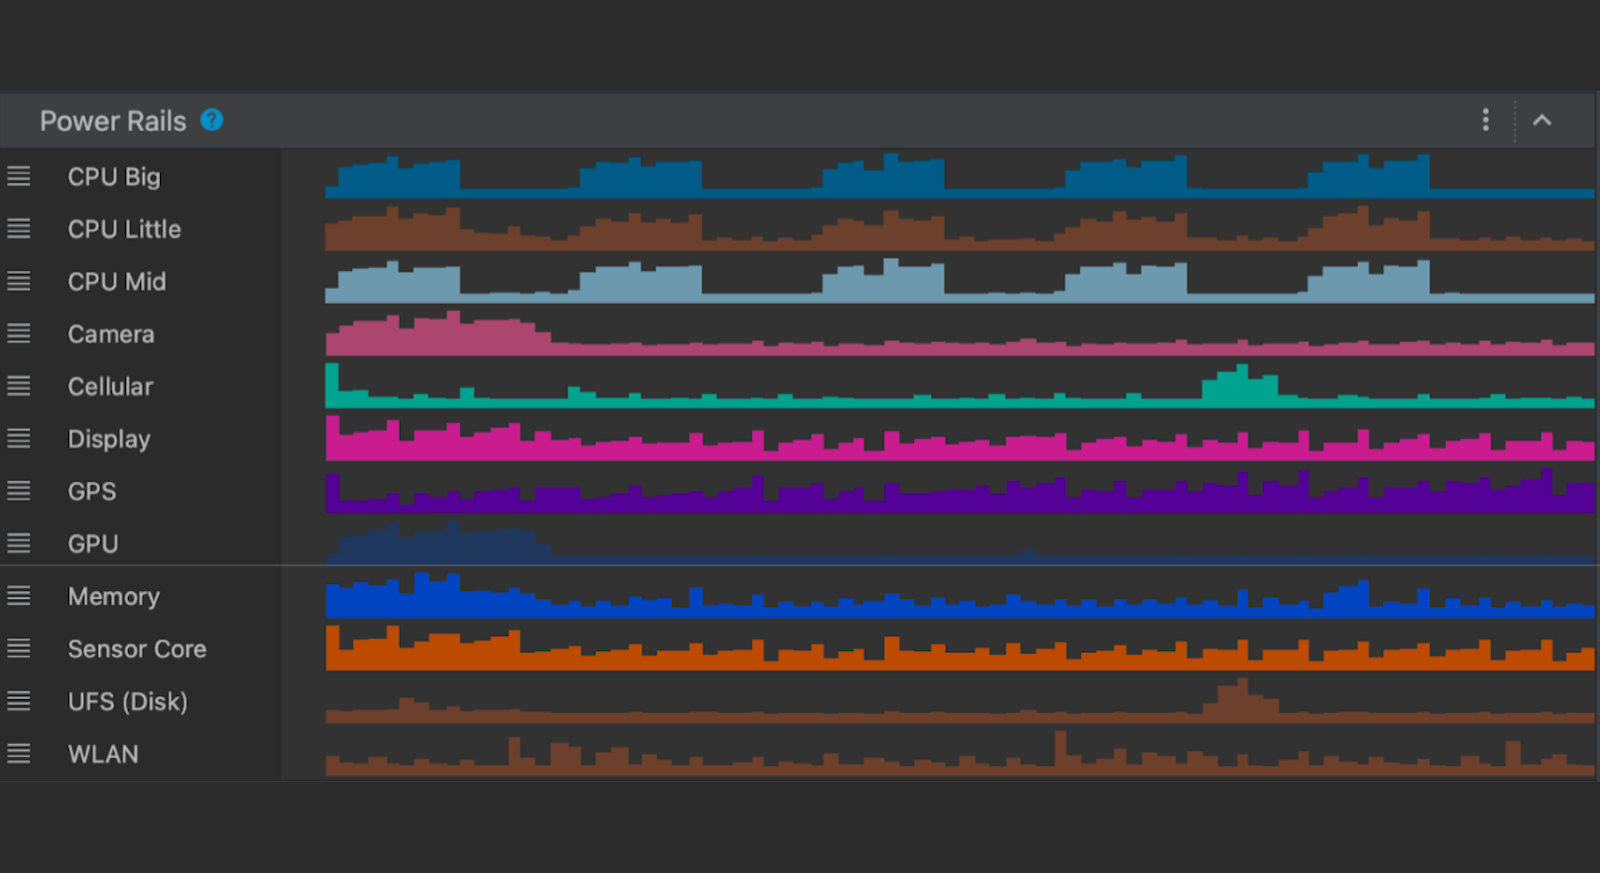
In this scenario, run your app while playing a 4K video and measure the power consumption during the first 30 seconds. Optionally, you can run scenario A multiple times and average the readings. Once the system trace appears in Android Studio, select a time range from 0 to 30 seconds from the timeline selection panel and record it as a screenshot for comparison with Scenario B.
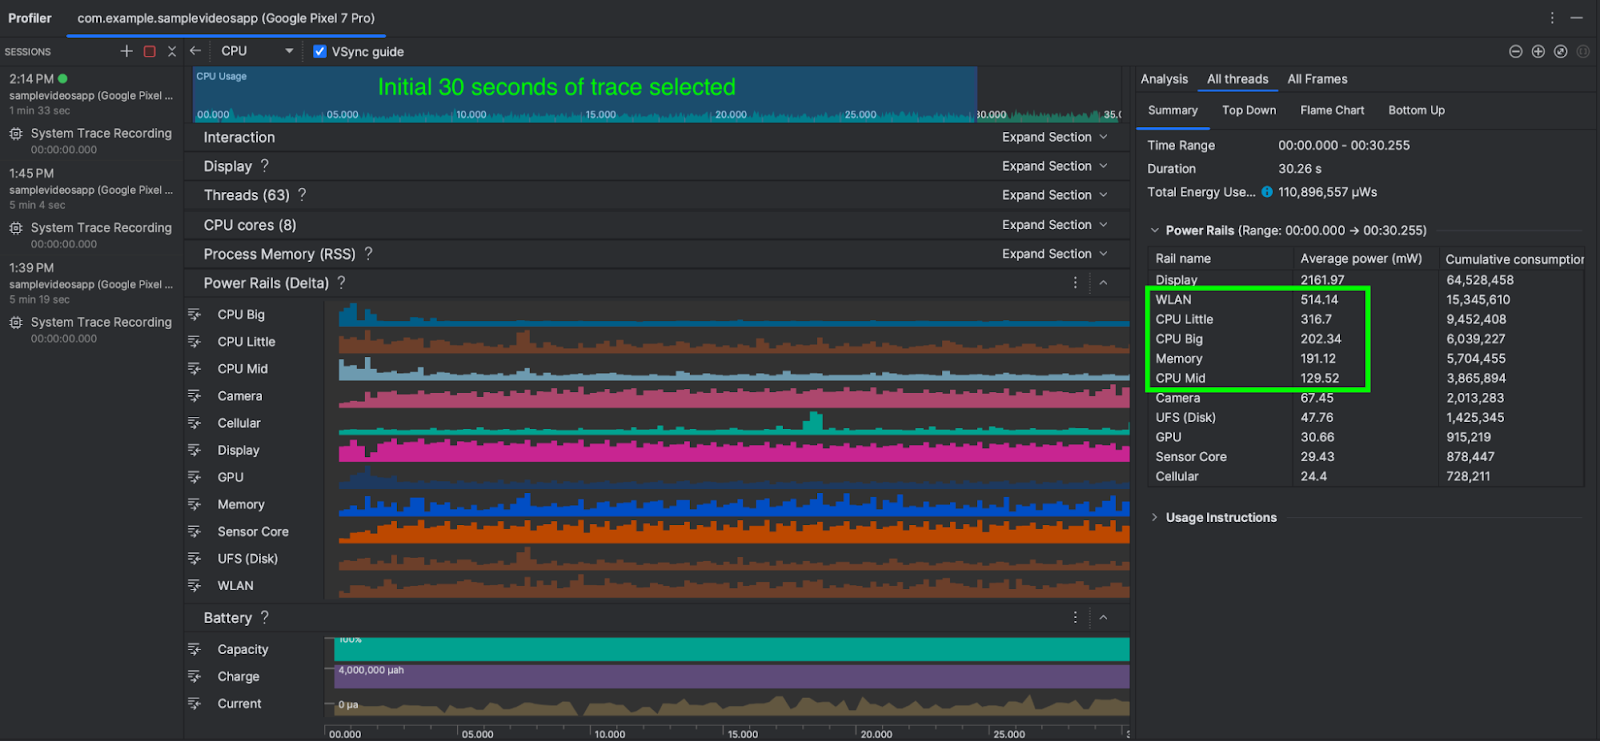
As you can see, the average power consumption for WLAN, CPU cores, and memory combined is approximately 1,352 mW (milliwatts).
Now let’s compare and contrast how this power consumption changes in scenario B.
Scenario B
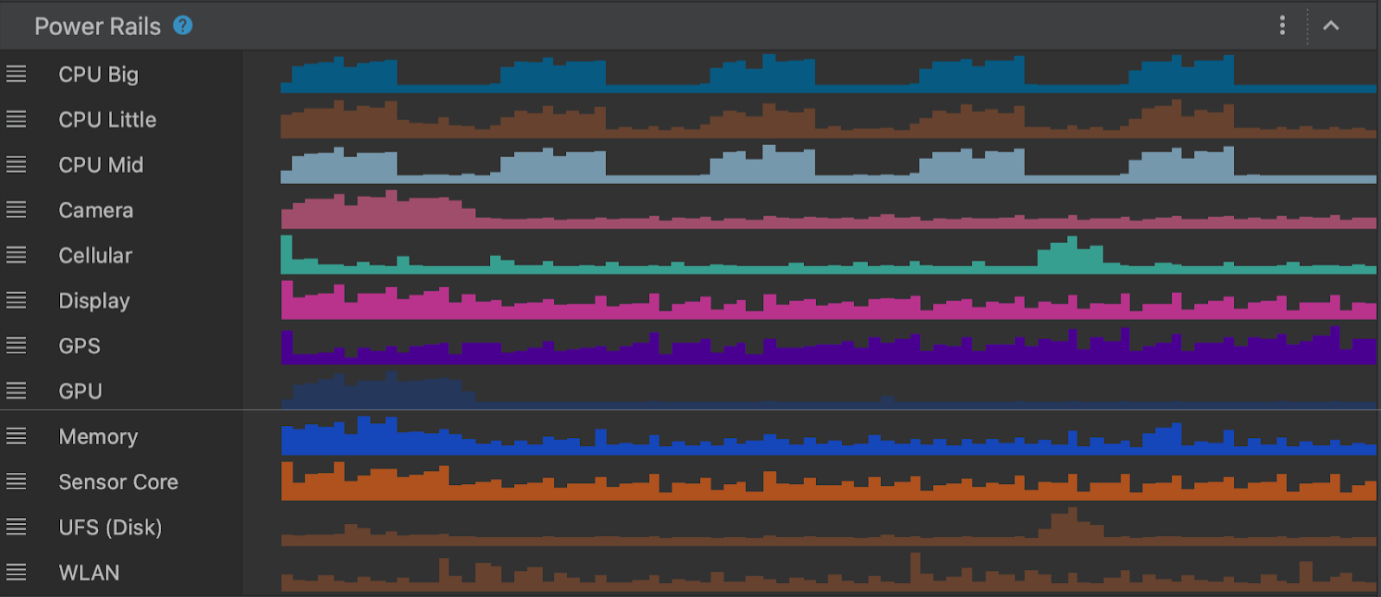
In this scenario, run your app while playing a low-quality video and measure the power consumption for the first 30 seconds. As before, you can optionally run Scenario B multiple times and average the power consumption measurements. Once again, when Android Studio displays the system trace, select a time range from 0 to 30 seconds from the timeline selection panel.
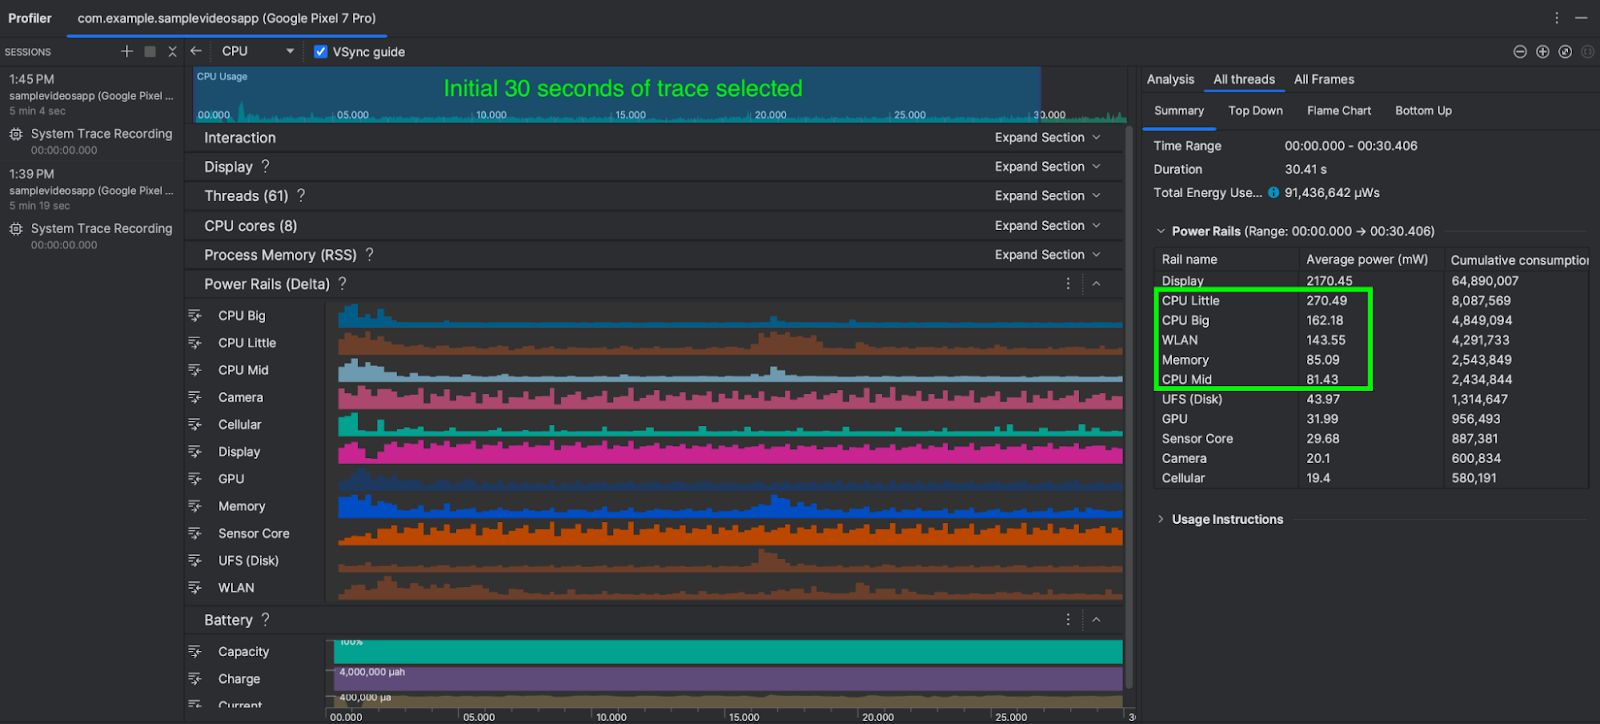
The total power consumed by WLAN, CPU Little, CPU Big, CPU Mid & Memory is approximately 741 mW (milliwatts).
conclusion
All else being equal, scenario B (low-quality video) consumed 741 mW of power, while scenario A (4K video) required 1,352 mW of power.
Scenario B (low quality video) consumed 45% less power than scenario A (4K). On the other hand, with low-quality videos, there is little visual difference in the perceived quality of the app screen.
The results of this power consumption A/B test show that replacing 4K video with lower quality video on an app’s home screen not only reduces power consumption by 45%, but also reduces the required network bandwidth, reducing potential We concluded that power consumption could also be improved. Thermal performance of the device.
If your app’s business logic requires displaying 4K video on your app’s screen, you can consider strategies such as the following:
- Cache 4K video on subsequent runs of the app.
- Load the video on user tap.
- Load the image first and load the video only after the screen is fully rendered (lazy loading).
While the overall power consumption numbers shown in the A/B test scenario above may seem small, app developers can use Android Studio’s Power Profiler to analyze the power consumption of their app’s features. Demonstrates techniques you can use to effectively A/B test.
next step
The new Power Profiler is available starting with Android Studio Hedgehog. Please refer to the official documentation for more information.