If you are confident that a transit signal is indeed coming from a particular star, you can apply for a time allocation to use the Zorro Speckle Imager on the Gemini South Telescope (a giant 8-meter telescope in Chile). This instrument takes image after image of the star, so it can “freeze” the effects of Earth’s atmosphere (similar to the distortions that cause stars to twinkle). This allows you to determine whether there is a nearby star that may be contaminating your measurements. If a star is close enough and some of its light is “leaking” into your candidate measurements, your transit depth will be smaller than it actually is. This means that you are underestimating the radius of the orbiting object, and what you believe to be planet-sized may actually be star-sized.
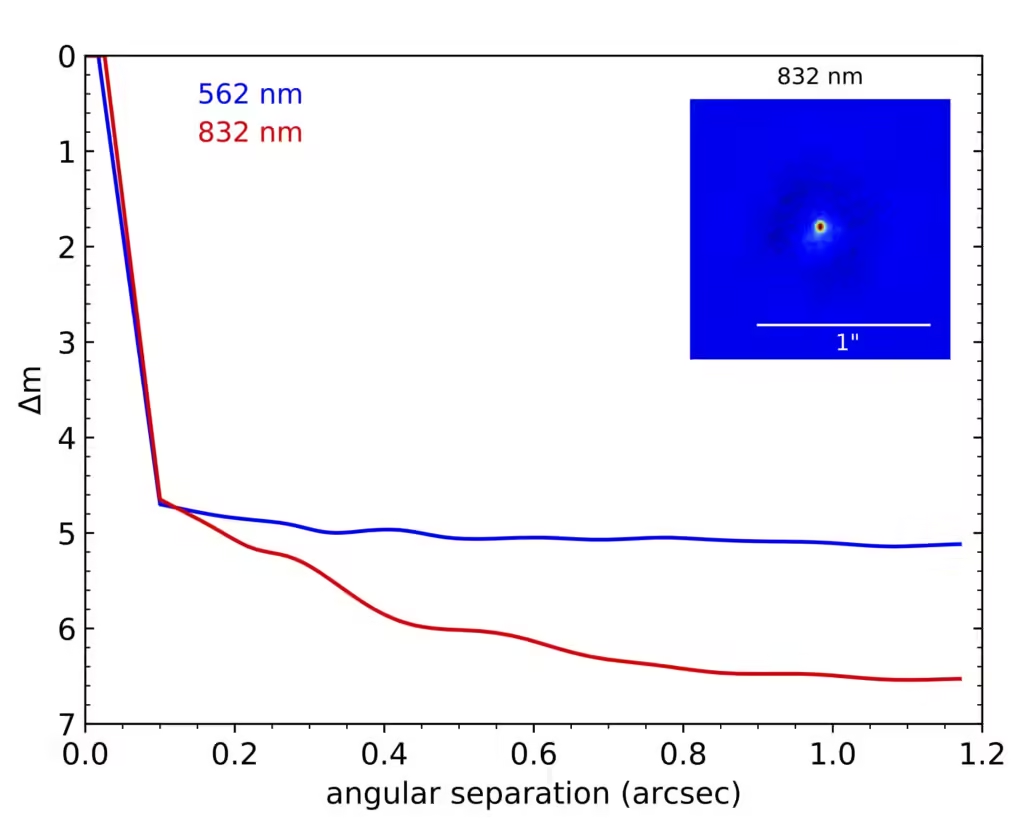
Below is a graph showing actual data taken from Gemini Southern Observatory’s Zorro instrument for one of the most promising planet candidates from Planet Hunters NGTS (subject 69654531, click this link to learn more). The two lines show data for two different wavelengths of light. The human eye typically sees light with wavelengths between 380 and 750 nanometers, but telescopes can use various filters to focus on ranges centered around specific wavelengths. In this case, the telescope splits the light beam (using a component called a dichroic) so that red light (centered at 832 nm) goes to one camera and blue light (centered at 562 nm) goes to the other camera. These two different measurements are shown in red and blue, respectively, in the graph below, allowing us to get a simultaneous two-color image of the target.

The horizontal axis of this graph shows the angular separation from the star in arcseconds, which is the unit used to measure the distance between points in the night sky (for example, the distance from one side of the Moon to the other as seen from Earth is 1,900 arcseconds). The vertical axis is called “contrast” or “magnitude difference”, a unit of apparent magnitude that indicates how faint the area around the star is compared to the star itself. What this graph shows is that between 0.1 and 1.2 arcseconds there are no stars with apparent magnitudes within about 5 magnitudes of the target star’s brightness, indicating that there are probably no nearby stars at this separation (although there could be very close stars). Using these observations we can be confident that the transit we are observing is “on target” (i.e., coming from the star we think it is), and we can be confident in our estimate of the candidate planet’s radius because we know the contamination levels are not too significant. This gives us the confidence we need to proceed with further follow-up observations, which we will discuss in the next part of this blog post series.

